Analytics
Analytics you can actually trust.
Not dashboards — diagnostics. Not vanity metrics — revenue intelligence.
Every competitor has the same problem
ActiveCampaign shows opens and clicks but never tells you why engagement dropped.
Substack blocks Google Analytics entirely — you get their dashboard or nothing.
Affiliate platforms require you to juggle three dashboards to answer one question.
Your numbers never match GA, and nobody can explain the difference.
Analytics built on four pillars
Each pillar answers a different question. Together, they give you the full picture.
Cross-Pillar Dashboard
One view across email, blog, viral loops, affiliates, and funnels. No tab-switching, no CSV exports, no dashboard-juggling. Every metric in one place.
Attribution
First-touch and last-touch attribution from UTM parameters and click IDs, written to the contact record. Linear and time-decay models are on the roadmap.
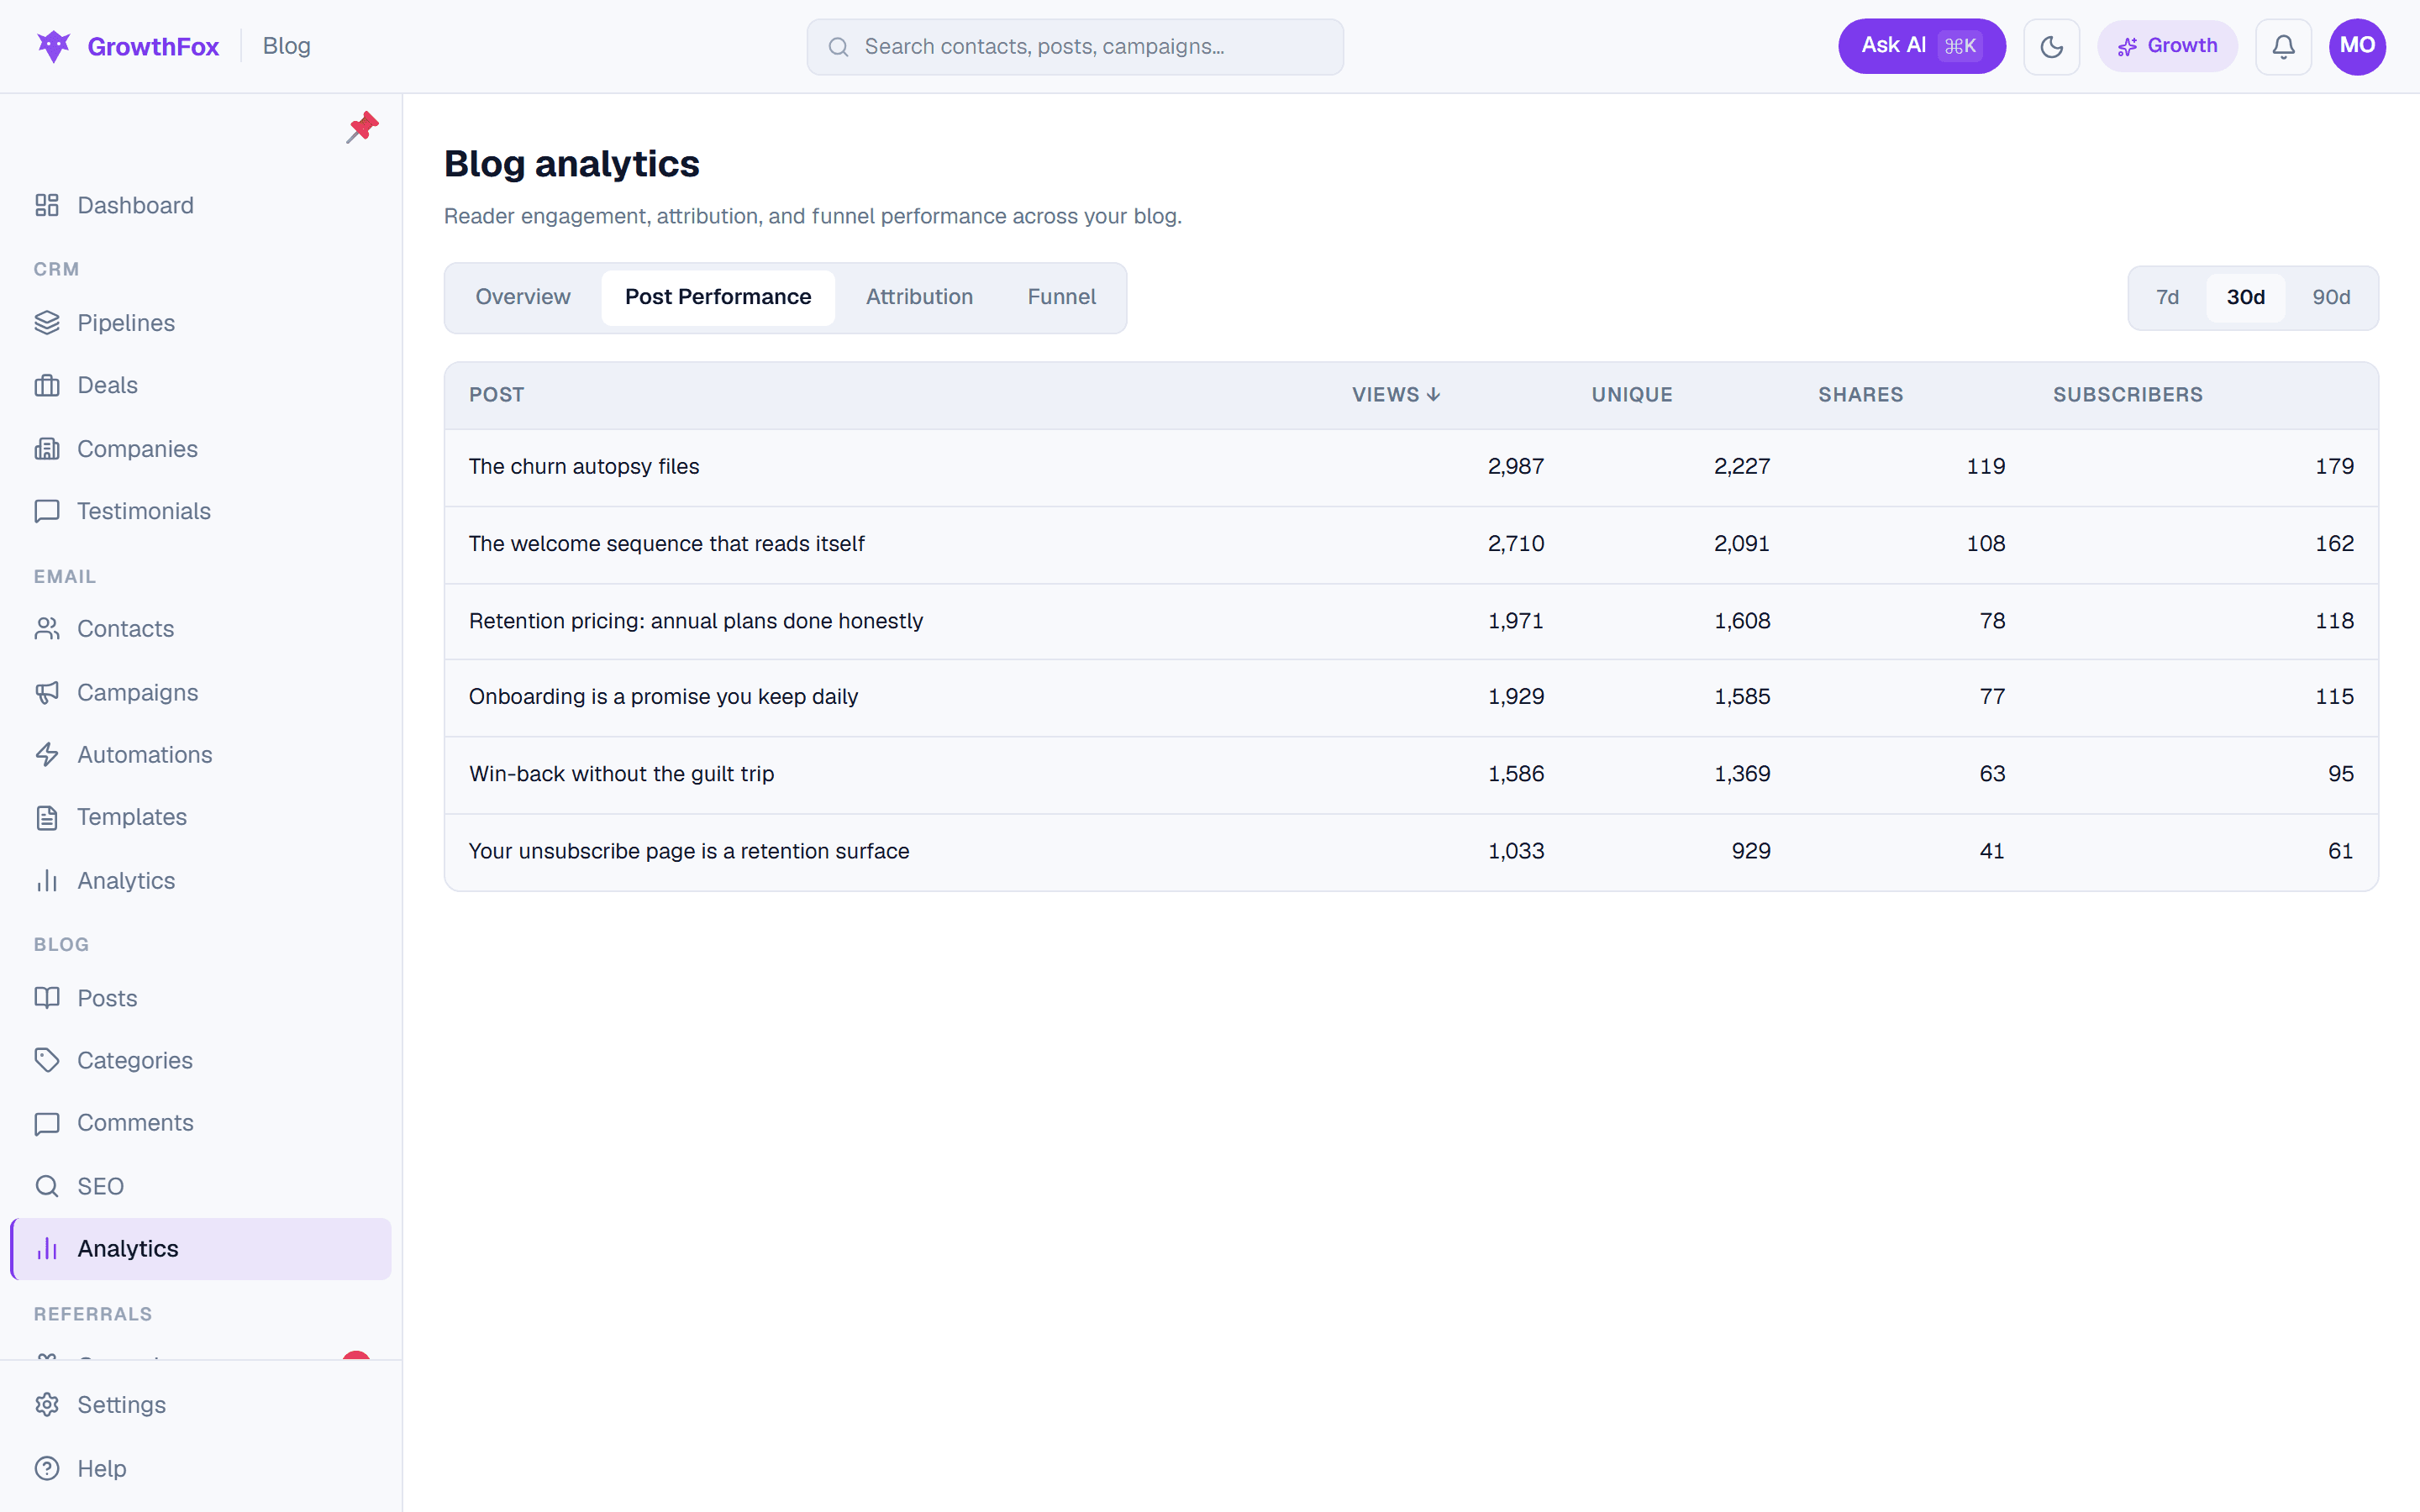
Content & Blog Analytics
Per-post reads, engagement, and section-level share attribution. Know which post — and which shared section — drove the signup.
Funnel Drop-off Analytics
Step-by-step conversion for every funnel. See exactly WHERE contacts drop off between steps — views, completions, and per-step drop-off rates.
What makes this different
Three principles that guide every analytics decision we make.
Reliable
Every metric definition is visible, and the API returns the same numbers as the dashboard. Numbers you can defend in a board meeting.
Legible
Opinionated defaults. Maximum four metrics per card. No 47-column spreadsheets masquerading as dashboards.
Actionable
Every report is queryable via the API — pull the underlying data into your own tools and act on it, not just stare at it.
Your data. Your way out.
We never hold your analytics hostage. Export everything, query everything, pipe it anywhere.
Stop guessing. Start diagnosing.
Join the waitlist for analytics that tell you what happened, why it happened, and what to do next.
See the full platform feature overview